

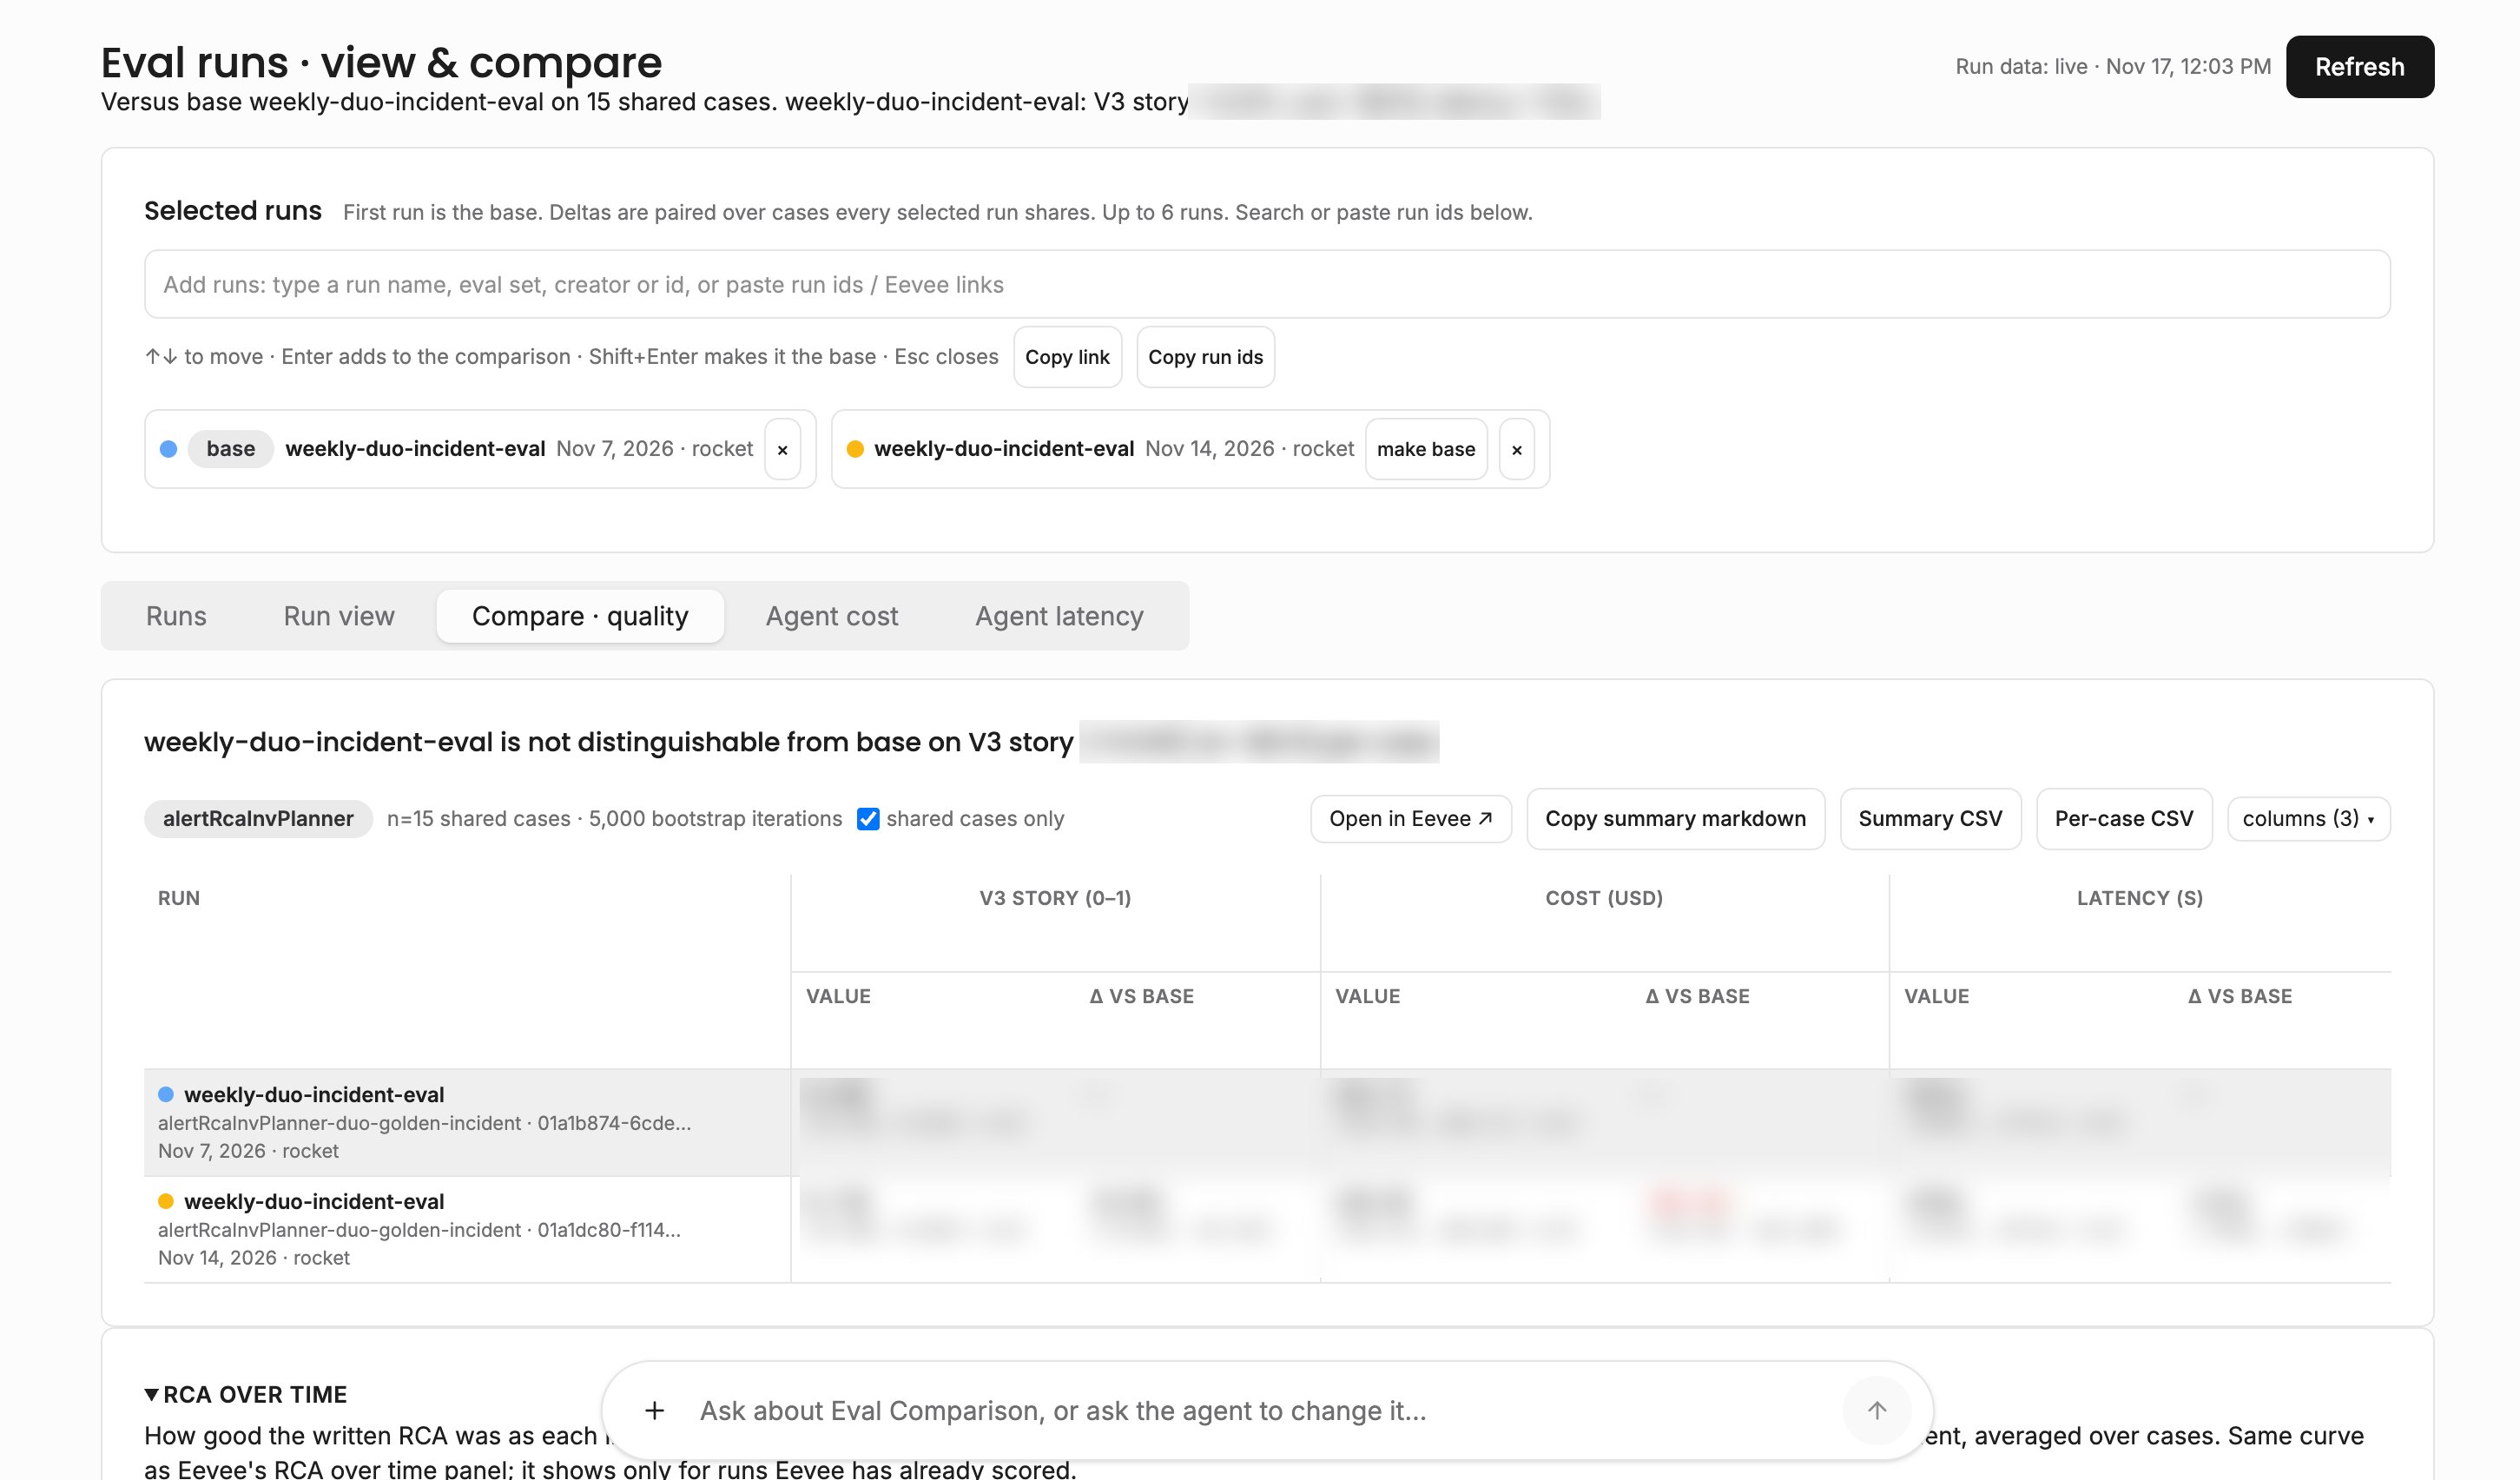
What it shows
- Run picker: search for runs by name, creator, or ID, or paste links. The first run is the baseline.
- Summary: a sentence stating which run is better or worse than the baseline, and by how much.
- Breakdowns: tabs for quality, cost, and latency, each with confidence intervals, plus cost and latency by agent type.
- Export: copy the summary as Markdown, download CSVs, or copy a link that opens the same comparison.
Prompt
One message, with a screenshot of the existing eval tool attached:can u make me a eval run view APP and comparison page? In [our eval tool] we have things like this screenshot. and then subview with scatterplot comparison for score, cost latency as well as these score at or above percentage. I want these breakdowns as well as the ability to do per-agent-type cost breakdowns / comparisons. there are also in a different tab latency comparisons between the agent types. take your time building this, use a couple files etcThe same approach works for anything you compare, such as canary and stable deploys, two load tests, or query plans before and after a change.